Stated estimates for city-integrated wind and solar PV are too high
by Lee Miller, Vaclav Smil, Gernot Wagner, and David Keith
Figure 1 of Kammen & Sunter places the energy demand of present-day cities (~20 W m-2) between “typical [and]... potential [renewable energy] performance, based on optimal conditions and technologies currently available in the laboratory.” Yet the
Wind range of 2.5-30 W m-2 is wrong, the Solar PV range of 10-120 W m-2 is misleading, and cold weather downtowns often require up to 500 W m-2.
After a wind farm extends downwind for more than ~10 km, including the consideration that wind turbines and the atmosphere will be directly interacting, limits the electricity generation rate to about 0.3-0.5 W m-2 globally, and about 1-1.5 W m-2 in windy locations [1-6] atypical of cities. First recognized by [7], this limit relates to the atmosphere’s ability to continually generate motion (~2 W m-2 globally), rather than the specifics of the wind technology.
Solar PV, based on observed 2015 generation rates and footprints from 3 newly constructed solar farms, generates about 11 W m-2 (8.7 W m-2 over 2400 acres by Agua Caliente Solar Project; 10.5 W m-2 over 3500 acres at Topaz Solar Farm; 13.2 W m-2 over 1475 acres at Central Valley Solar Ranch, [8-13] consistent with [14,15]). 10 W m-2 is, therefore, not “conservative” (p.922), but rather representative of state-of the art industrial facilities presently operating in regions of flat terrain with excellent insolation, and receiving ongoing maintenance. A doubling of PV generation to ~20 W m-2 could be achieved if the entire city surface was PV – this does not violate physical laws, but is oblivious to economic trade-offs of cost vs efficiency. These physical and economic considerations explain why current PV generation rates in cities are typically lower than industrial sites.
Integrating renewables into cities is possible, and it might reconnect us to our environment with everyday reminders of our energy demands. A sound path begins by establishing achievable, near-term realities for renewables, and then incrementally leveraging these small successes.
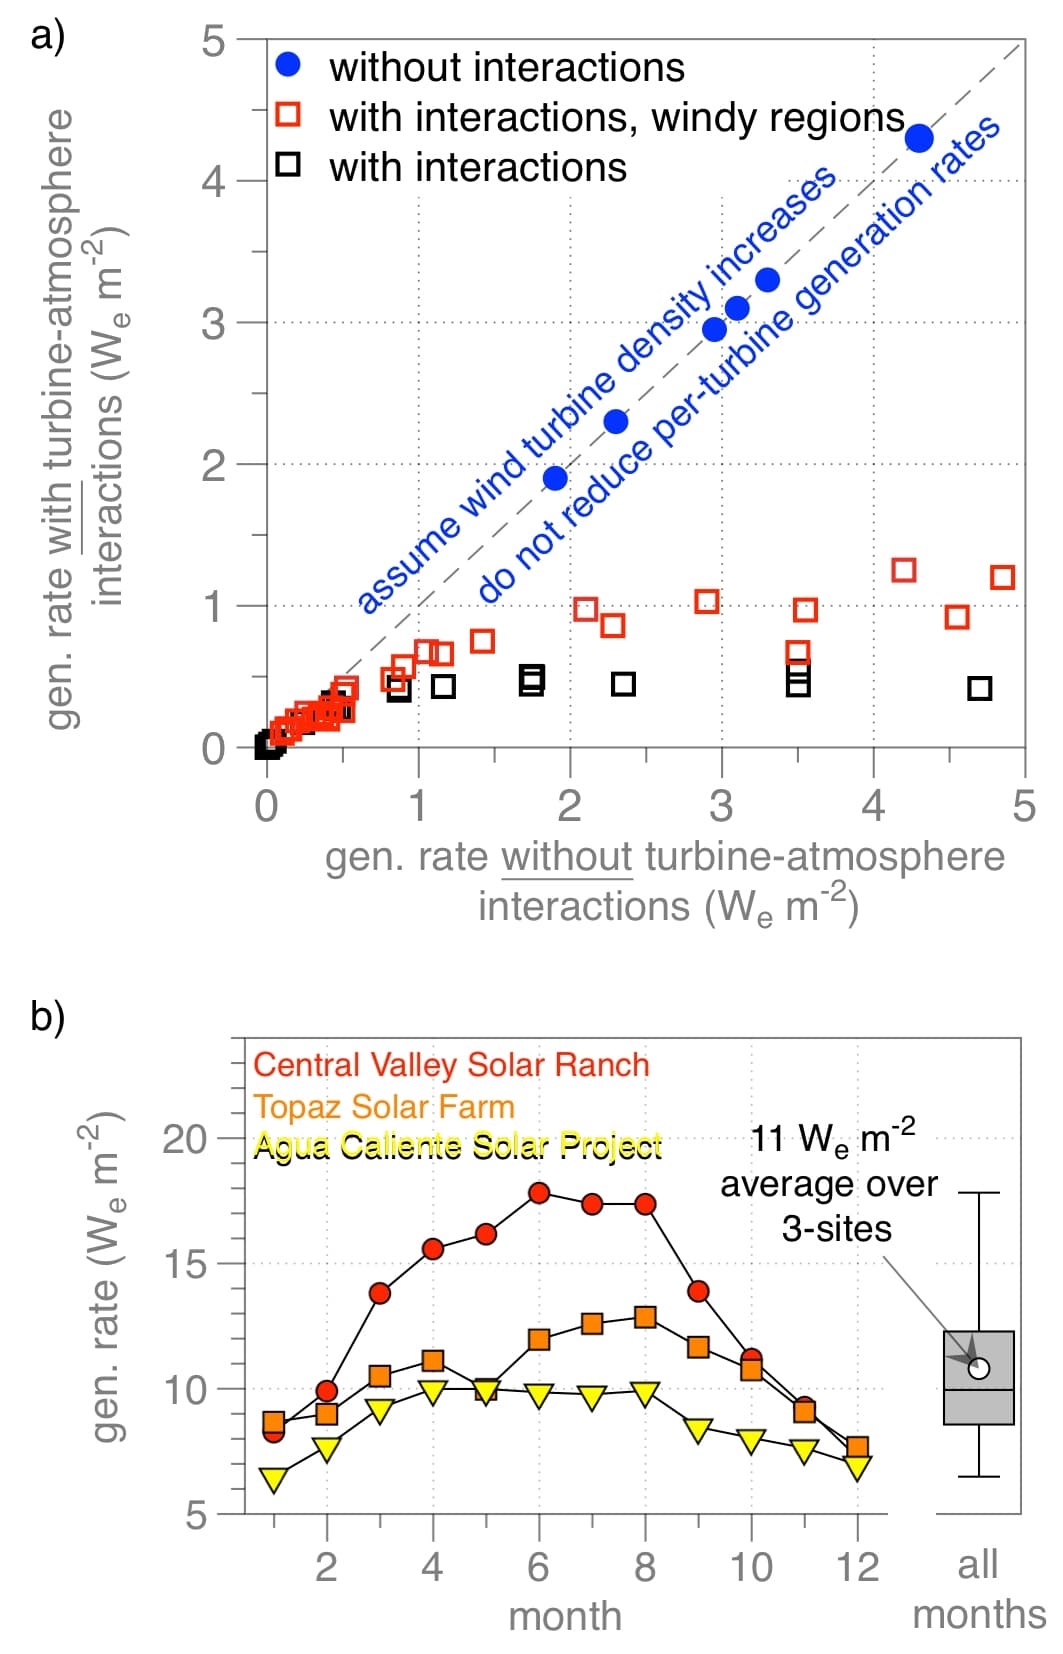
Figure captions:
(a) Showing the result of estimating electricity generation rates from wind power which fail to consider (x-axis) or include (y-axis) how wind farms can slowdown wind speeds and alter atmospheric transport. Note how, for generation rates less than about 0.25 We m^-2, estimating generation rates with or without turbine-atmosphere interactions yield similar generation rates – these instances represent wind farms with larger between-turbine spacing, and therefore reduced interactions. The blue circles represent studies which did not include interactions, while squares represent studies which estimated generation rates with and without interactions. The red squares highlight those ‘with turbine-atmosphere interaction‘ studies which estimated generation rates for wind farms in only windy locations [1,4,6]. All data points are the same as shown in Fig. 5 of [6].
(b) Observed monthly mean generation rate during 2015 for 3 industrial-scale solar PV farms in California and Arizona (USA) [8-13].
[1] Keith DW, et al. (2004) The influence of large-scale wind power on global climate. Proc. Natl. Acad. Sci. USA 101 (46): 16115-16120
[2] Miller LM, Gans F, Kleidon A (2011) Estimating maximum global land surface wind power extractability and associated climatic consequences. Earth Syst. Dynam. 2:1-12
[3] Jacobson MZ, Archer CL (2012) Saturation wind power potential and its implications for wind energy. Proc. Natl. Acad. Sci. USA
[4] Adams AS, Keith DW (2013) Are global wind power resource estimates overstated? Environ. Res. Lett. 8:015021
[5] Marvel K, Kravitz B, Caldeira K (2013) Geophysical limits to global wind power. Nature Climate Change. 3, 118-121
[6] Miller LM, et al. (2015) Two methods for estimating limits to large-scale wind power generation. Proc. Natl. Acad. Sci. USA 112 (36) 11169-11174
[7] Gustavson M (1979) Limits to wind power utilization. Science 204 (4388) 13-17
[8] Department of Energy (2010) Final environmental assessment for Department of Energy Loan Guarantee for Agua Caliente Solar Project in Yuma County, Arizona. DOE/EA-1797
[9] Harvey & Associates (2010) Biological assessment for the California Valley Solar Ranch Project San Luis Obispo County, California.
[10] Department of Energy (2011) Final environmental impact statement Volume I, Department of Energy loan guaranteee to Royal Bank of Scotland for construction and startup of the Topaz Solar Farm San Luis Obispo County, California DOE/EIS-0458
[11] U.S. Energy Information Administration. Electricity data browser for Agua Caliente Solar Project, monthly. http://www.eia.gov/electricity/data/browser/#/plant/57373 (data for 2014-2016 accessed on May 24)
[12] U.S. Energy Information Administration. Electricity data browser for California Valley Solar Ranch Project, monthly. http://www.eia.gov/electricity/data/browser/#/plant/57439 (data for 2014-2016 accessed on May 24)
[13] U.S. Energy Information Administration. Electricity data browser for California Valley Solar Ranch Project, monthly. http://www.eia.gov/electricity/data/browser/#/plant/57695 (data for 2014-2016 accessed on May 24)
[14] Smil V (2015) Power density: a key understanding energy sources and uses. MIT Press.
[15] MacKay DJ (2009) Sustainable energy -- without the hot air. UIT Cambridge.