Climate policy curves highlight key mitigation choices
by Martin C. Hänsel, Michael D. Bauer, Moritz A. Drupp, Gernot Wagner & Glenn D. Rudebusch

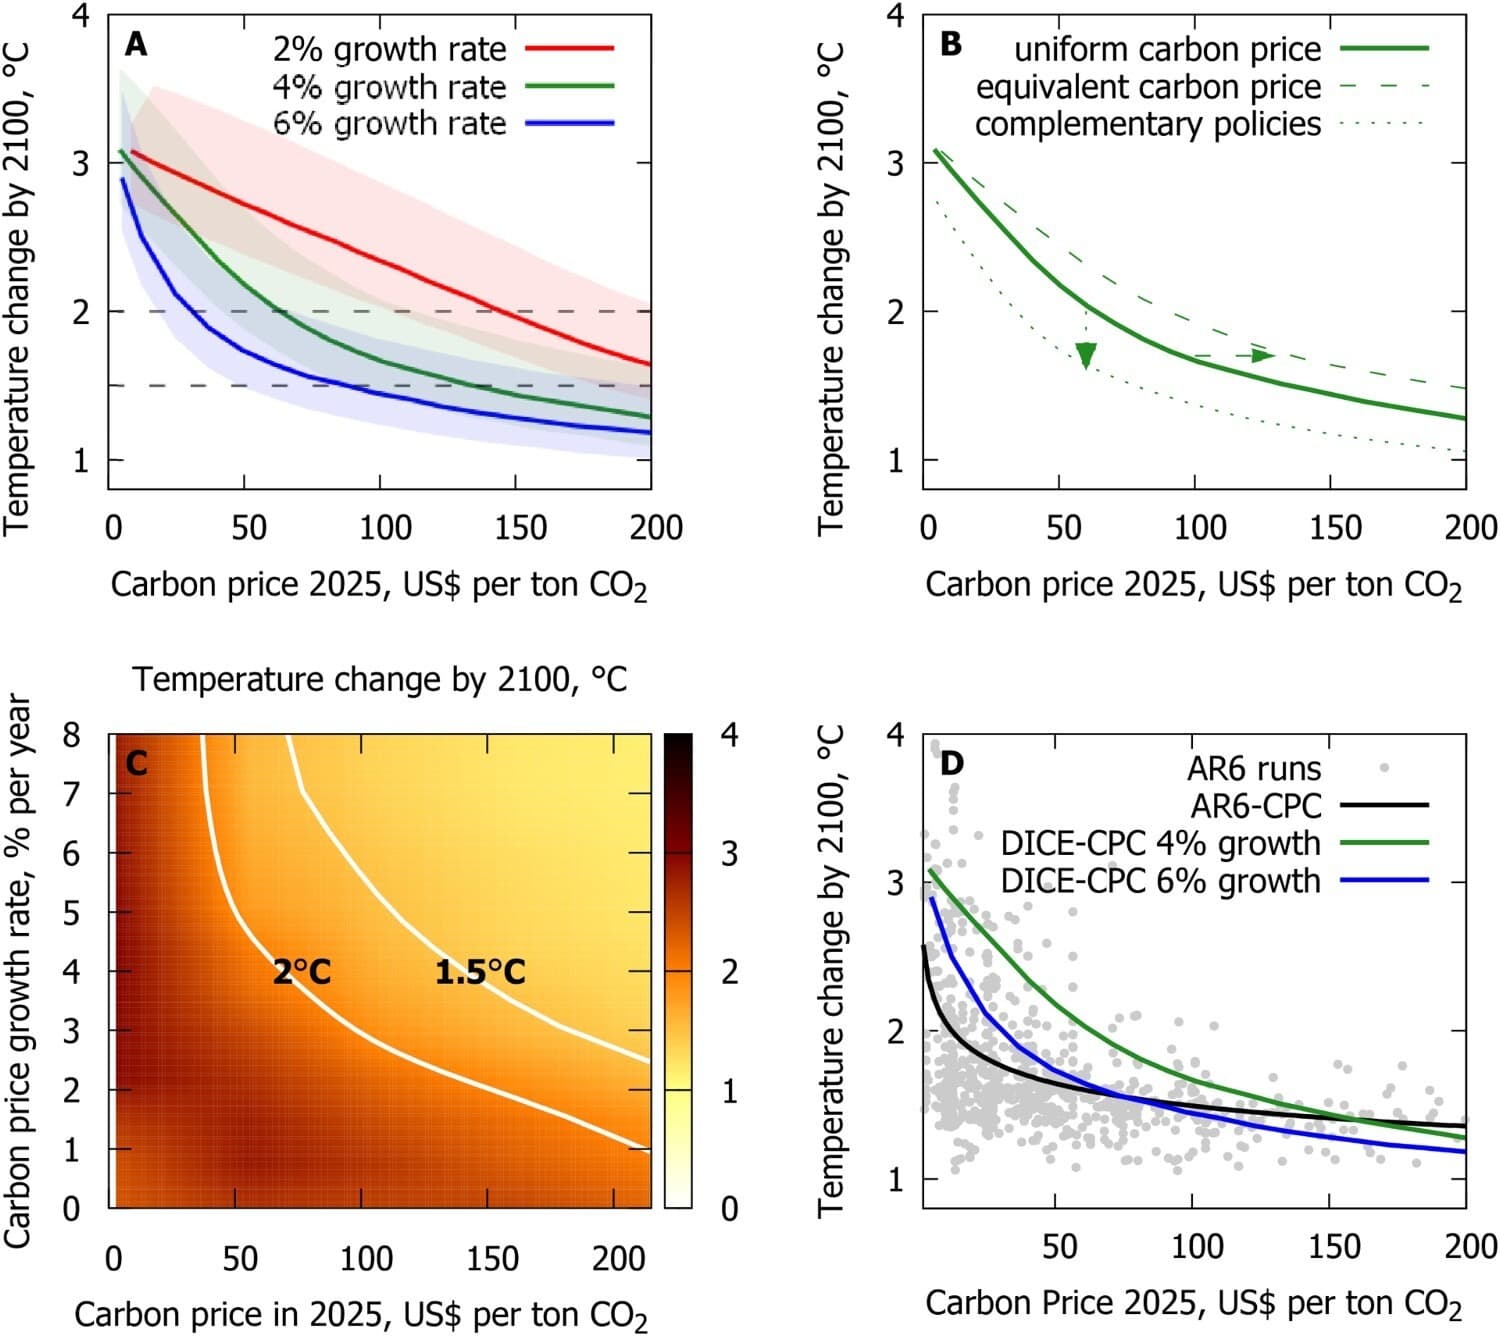
Figure 1. Quantifying Climate Policy Curves (CPCs). The relationship between the carbon price per ton of CO2 in 2025, the annual constant growth rate for future carbon prices (2% (red), 4% (green) and 6% (blue)) and the global temperature by 2100 (above the 1850–1900 average). Panel A shows climate uncertainty shaded regions based on ‘likely’ ranges (66% probability) for the equilibrium climate sensitivity between 2.5 and 4°C in the IPCC AR6 report (World Bank Citation2023). Panel B illustrates how the 4%-CPC shifts when alternative policies that are translated into an equivalent carbon price trajectory are implemented either as a substitute for (dashed green line) or a complement to the uniform carbon price (dotted green line). For our illustration we assume that complementary policies increase the emission reduction rate by an arbitrary 20% in each period, while policies that only substitute a uniform carbon price reduce the emission reduction rate by a factor of 20% (see Supplementary Information B for details). Panel C shows a heatmap of global average temperature increase by 2100 for various combinations of initial carbon prices in 2025 and annual carbon price growth rates. The temperature colour scale is shown on the right. Contours that indicate carbon price paths that lead to Paris Agreement temperature goals are denoted by white lines. Panel D shows a comparison of DICE-based CPCs with a CPC fitted to AR6 model simulations. The grey dots represent AR6 data on the 2025 carbon price per ton of CO2 and the global-mean surface air temperature (GSAT), and the black line fits a power function to these data. The green and the blue line are the CPCs based on an updated DICE model with 4% and 6% carbon price growth rates. All prices are in 2022 dollars. See the Supplementary Information for a description of methods.
One-sentence summary:
CPCs highlight the key trade-off between initial policy ambition and the subsequent policy burden left for future generations.
Abstract:
The extent of future climate change is largely a policy choice. We illuminate this choice with climate policy curves (CPCs), which link climate policies to subsequent global temperatures. The estimated downward sloping CPCs highlight the key trade-off between initial policy ambition, expressed via an overall effective carbon price, and the subsequent policy burden left for future generations. We also demonstrate how different CPCs can illustrate the range of climate policy paths towards attaining the Paris Agreement temperature goals. Based on the latest Intergovernmental Panel on Climate Change (IPCC) integrated-assessment model scenarios, we estimate an implicit CPC, which provides a high-level summary of assumptions underlying the IPCC’s assessment about climate policy trade-offs. We show that by virtue of their reductionism, CPCs serve as a useful model diagnostic and communication tool for climate policy discussions.
Published version: "Climate policy curves highlight key mitigation choices" [PDF]
Prior versions: "Climate Policy Curves: Linking Policy Choices to Climate Outcomes" (CESifo Working Paper No. 10113, 17 November 2022; Brookings Working Paper, December 2022)


