Establishing practical estimates for city-integrated solar PV and wind
by Lee Miller, Vaclav Smil, Gernot Wagner, and David Keith
Reply to Kammen, Sunter, and Dabiri's reply to Miller et al.'s Science eLetter.
We challenged Kammen & Sunter [1] because their city-scale estimates were too high. Industrial-scale solar farms currently generate less than 20 We/m^2 (Kammen & Sunter noted 10-120 We/m^2) and city-scale wind farms could generate no more than about 1 We/m^2 (Kammen & Sunter noted 2.5-30 We/m^2). When compared to the ~28 W/m^2 average consumption rate of the 10 most populous cities, the 29 W/m^2 of Berkeley (CA), or the 47 W/m^2 of Cambridge (MA), hopefully our reason for forcing this debate is immediately clear.
We are trying to establish practical estimates for city-integrated solar PV and wind. Reflecting on our debate thus far, we are converging on solar. The opposite is true for wind, where their revised estimate of 35 We/m^2 is higher and therefore more wrong than before.
Figure 1a shows the average consumption rates of the 10 most populous cities in the US, as well as the chronology of solar PV and wind estimates raised in this debate so far.
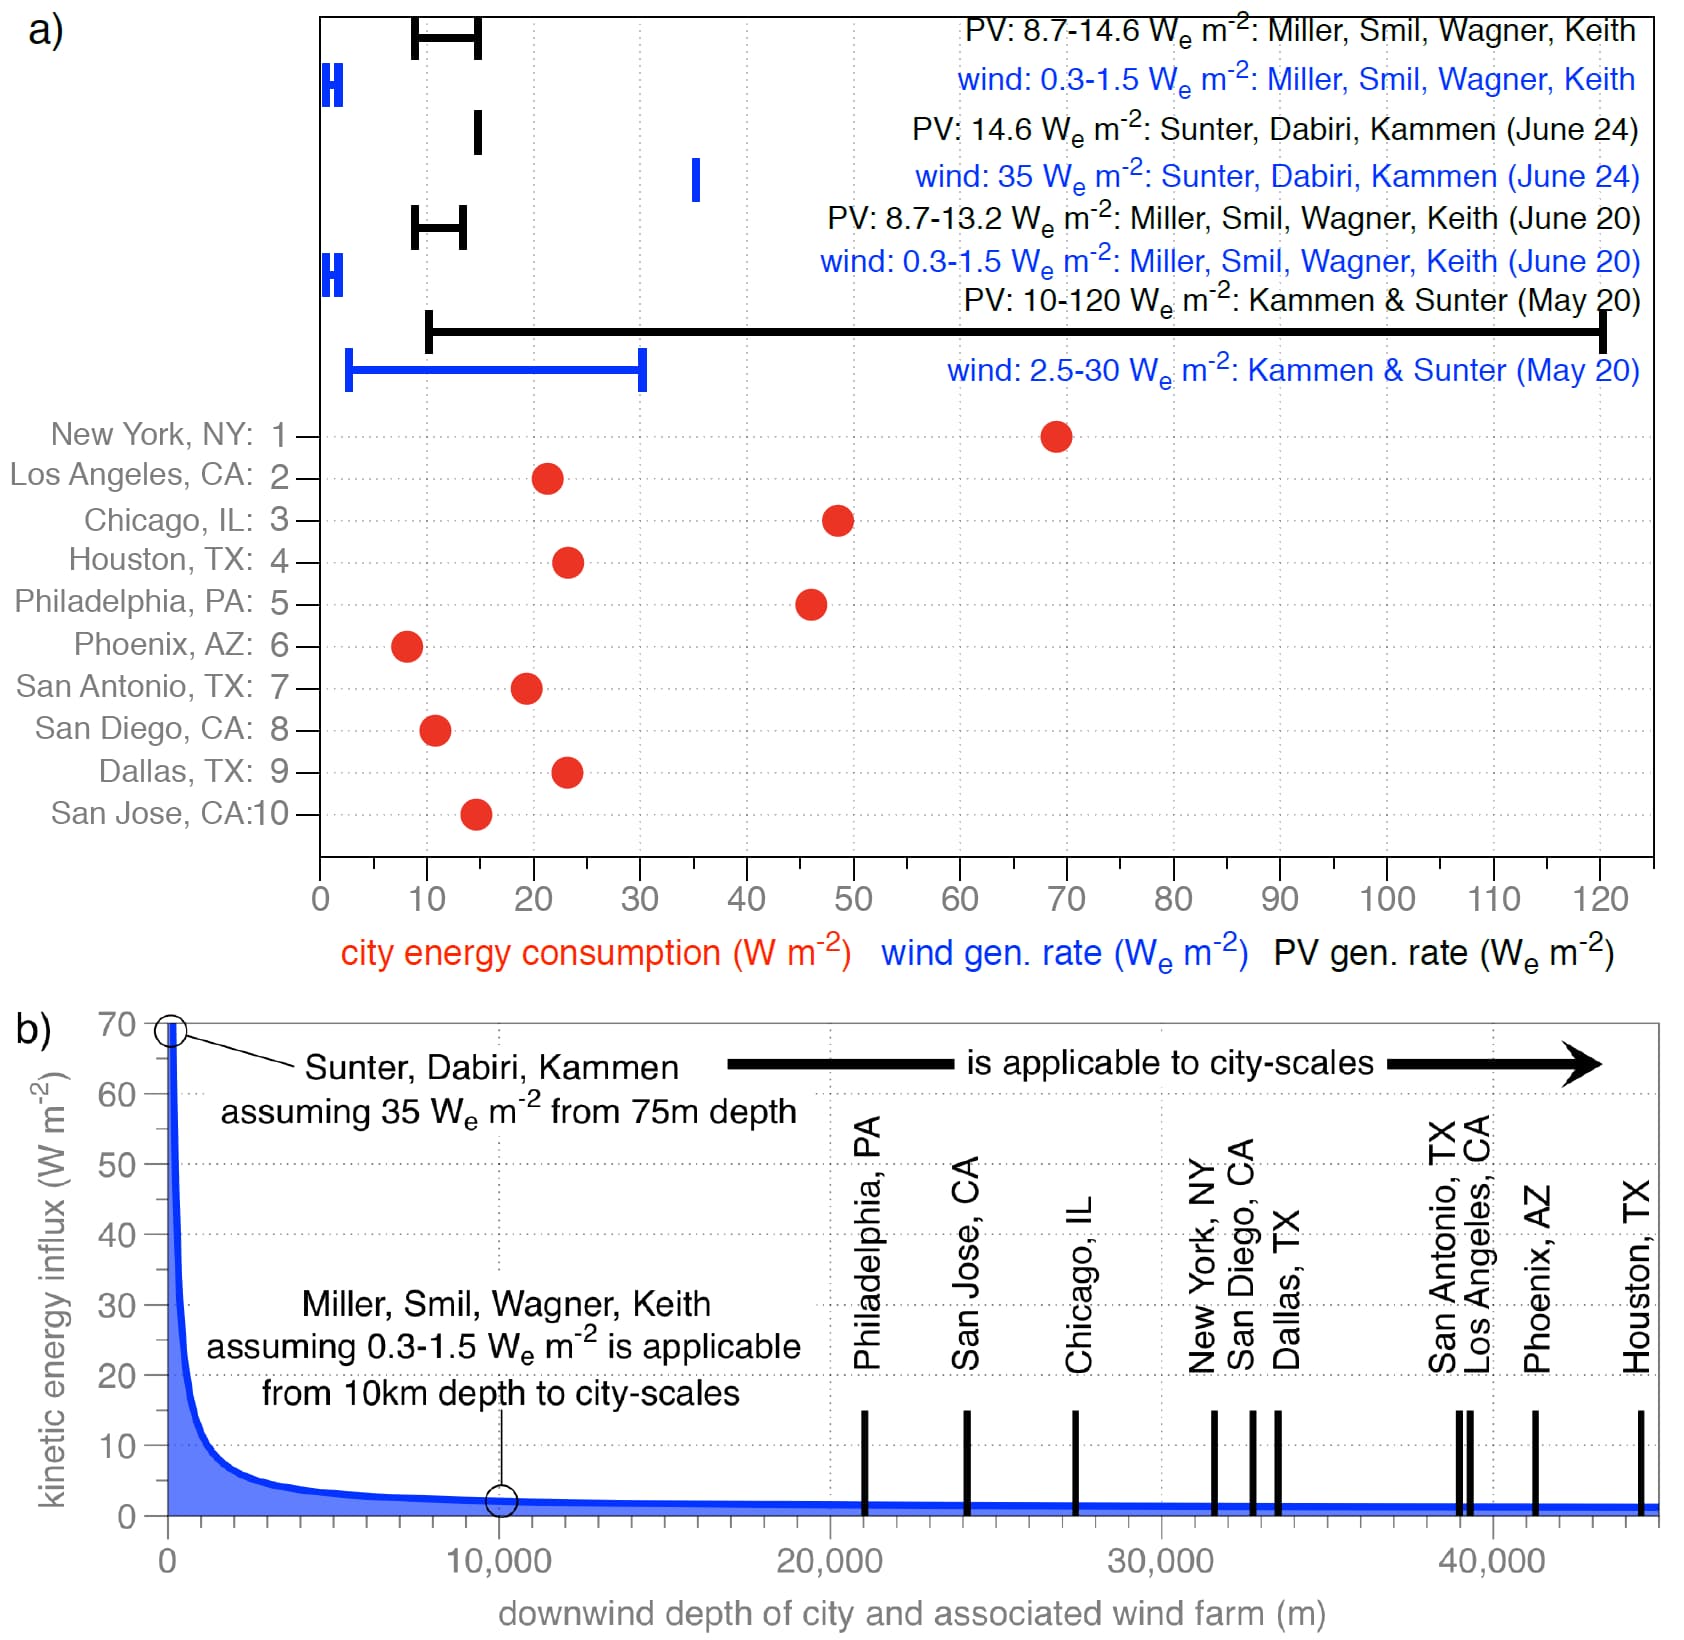
Figure 1. a) In red, mean average energy consumption rate in 2014, estimated by deriving an average per capita energy consumption rate for each state [13,14], scaling this to the city population, and dividing by the city’s area [14]. The blue text shows the chronology of the estimated wind (blue) and solar PV (black) generation rates. b) Assuming the same climatology for all locations and the incoming kinetic energy flux is full available (no wind power deployed upwind), showing how our simple kinetic energy budget estimates a kinetic energy flux into the upwind edge of a city at more than 70 W/m^2 for very small depths (10-100s of meters) but drops to 2-3 W/m^2 at downwind depths typical of major US cities. Our assumption is that about half of the kinetic energy influx shown on the y-axis could be extracted for electricity generation.
Kammen & Sunter’s original manuscript [1] stated a solar PV range of 10-120 We/m^2. We responded with observed solar farm data that was perhaps overly precise at 8.7-13.2 We/m^2, as Sunter, Dabiri, and Kammen then responded with another observation that was just above our range. Solar farms on flat ground could hit 20 We/m^2 in the very near-future, but the estimate is only part of the story here. We would be quite cautious in using any operational solar farm data as applicable to city-scales, as cities will exhibit complex shading considerations, more difficult operation and maintenance, and competing uses for land.
We agree that if all surfaces (roads, buildings, parks) in the city were completely blanketed with solar PV that operate at a 40% efficiency, one could achieve 120 We/m^2 in many locations. The math here is obvious, but incorporating such estimates into practical policy decisions is irrelevant. Reconfiguring a city to generate just the 20 We/m^2 noted above should be recognized as a monumental challenge, even leveraging the recent drops in PV manufacturing costs.
On wind, Kammen & Sunter [1] originally noted a range of 2.5-30 We/m^2. We noted a range of 0.3-1.5 We/m^2, to which Sunter, Dabiri, and Kammen responded with 35 We/m^2.
We reiterate that the limit to city-scale wind power generation has little to do with the specifics of the technology and rather relates to considerations of spatial scale. We recognize that [2,3] observed generation rates of 21-47 We/m^2, where in [2] the total generation rate is “Averaged over the 48.6-m^2 footprint of the six-turbine VAWT [vertical axis wind turbine] array…”. For reference, New York City is about 784 000 000 m^2, and it is very much unlike an experimental site that is “vacant desert …[with] topography [that] is flat for approximately 1.5 km in all directions” [2]. Moreover, as stated in [3], “[the] unexpected, even provocative conclusion [of ~35 We/m^2 from 6-24 10-meter tall 1.2 diameter vertical axis wind turbines in various arrangements being applicable to larger scales] awaits confirmation either experimentally in larger-scale field studies or numerically in large-scale simulations that account for how the atmospheric boundary layer adjusts to the presence of the VAWT farm.”
Such energetically consistent large-scale simulations, which include how the atmosphere will respond to wind turbines near the surface, formed the basis for our estimate of 0.3-1.5 We/m^2 [4-9]. These results from various researchers show that large-scale energetics prevents generation rates of anywhere near 35 We/m^2 from occurring at scales of 350-1600 km^2, reflecting the areas of the 10 most populous cities in the US.
There is no doubt that a single isolated turbine, or a line of turbines aligned perpendicular to the wind direction, could be influenced by a horizontal kinetic energy flux well over 70 W/m^2, if one considers only the physical footprint of the wind turbines. For cities, while the kinetic energy entering the upwind boundary of the city could be quite large, many cities extend downwind for 20 to 40 km (Philadelphia, Houston). At this downwind edge, the downward kinetic energy flux maintains the winds. Cities with wind power would utilize this entire expanse, so how can we estimate their limit to large-scale wind power generation?
As we know that energy must be conserved within the system, kinetic energy entering the city from the side and above provide a hard limit to how much electricity could be generated.
The horizontal KE flux into the city is: 0.5•ρ(v^3)•H•W, where the air density is ρ=1.2 kg/m^3, the wind speed v =5 m/s, the height is H ≈ 200m, and W is the width (m). The vertical flux downward into the city is ρ((u*)^2)•v•L•W, where the friction velocity of a city is about 0.5 m/s [10], and L is the downwind depth of the wind farm (m), referenced from the upwind boundary.
Figure 1b shows how the kinetic energy flux changes with the downwind depth (assuming each city can be approximated as a circular area), including downwind extents of the 10 most populous US cities. Note the 70 W/m^2 of kinetic energy entering the city at the upwind boundary – this could generate the 35 We/m^2 noted in the previous eLetter response by Sunter, Dabiri, and Kammen. By 1km downwind, the kinetic energy influx has dropped to 10 W/m^2, to 3 W/m^2 at 5km downwind, and to 1.5 W/m^2 by about 20 km. This 20km depth is approximately Philadelphia, the smallest of the 10 most populous US cities. This 1.5 W/m^2 is also in agreement with long-standing energetics-based estimates on what maintains our present-day climate [11,12].
Assuming half of the kinetic energy could result in electricity generation, this simple approximation suggests that no more than about 1 We/m^2 could be generated over the footprint of the city, regardless of the technology or their density.
Conclusion
We applaud the amazing solar PV cost reductions over the past few years. It is unequivocal good news and may be the most instrumental enabler to propel PV to being a major contributor to power generation. Assuming one could transform Phoenix, San Diego, or San Jose into commercial-scale solar farms, then these cities might be able to meet their average energy consumption rates. However, wind power could not meet the energy consumption rates of any of these cities. Other cities like Chicago, Philadelphia, and New York City seem unlikely to achieve renewable energy independence using either, or both, wind and solar.
There is significant room for further renewables integration—especially solar—in cities. But the greater opportunity for renewables like wind and solar resides outside the boundaries of the cities, as well as connecting cities to distant sunny or windy locations with high voltage transmission. This alternative approach, with sufficient large-scale deployment of solar PV or wind turbines, could power cities, and hopefully even yield a positive economic return on the investment into our collective future.
References
[1] Kammen D, Sunter D (2016) City-integrated renewable energy for urban sustainability. Science. 352, 6288, 922-928
[2] Dabiri J (2011) Potential order-of-magnitude enhancement of wind farm power density via counter-rotating vertical-axis wind turbine arrays. Journal of Renewable and Sustainable Energy, 3, 043104
[3] Dabiri J (2014) Emergent aerodynamics in wind farms. Physics Today. 67, 66-67
[4] Keith DW, et al. (2004) The influence of large-scale wind power on global climate. Proc. Natl. Acad. Sci. USA 101 (46): 16115-16120
[5] Miller LM, Gans F, Kleidon A (2011) Estimating maximum global land surface wind power extractability and associated climatic consequences. Earth Syst. Dynam. 2:1-12
[6] Jacobson MZ, Archer CL (2012) Saturation wind power potential and its implications for wind energy. Proc. Natl. Acad. Sci. USA
[7] Adams AS, Keith DW (2013) Are global wind power resource estimates overstated? Environ. Res. Lett. 8:015021
[8] Marvel K, Kravitz B, Caldeira K (2013) Geophysical limits to global wind power. Nature Climate Change. 3, 118-121
[9] Miller LM, et al. (2015) Two methods for estimating limits to large-scale wind power generation. Proc. Natl. Acad. Sci. USA 112 (36) 11169-11174
[10] Luhar A, Venkatram A, Lee S (2006) On relationships between urban and rural near-surface meteorology for diffusion applications. Atmospheric Environment. 40, 6541-6553
[11] Lorenz E (1955) Available potential energy and the maintenance of the general circulation. Tellus. 7. 271-281
[12] Peixoto J, Oort A (1992) Physics of climate. American Institute of Physics. Springer-Verlag, New York (USA)
[13] U.S. Energy Information Administration. Primary energy consumption estimates for 2014. (average state energy consumption rate in 2014, accessed July 14, 2016)
[14] US Census Bureau, QuickFacts United States. (city area and city population data current as of July 14, 2016)